Sample deliverable — fictional data
MA-2026-006 · 10 pages · free PDF
What this report shows
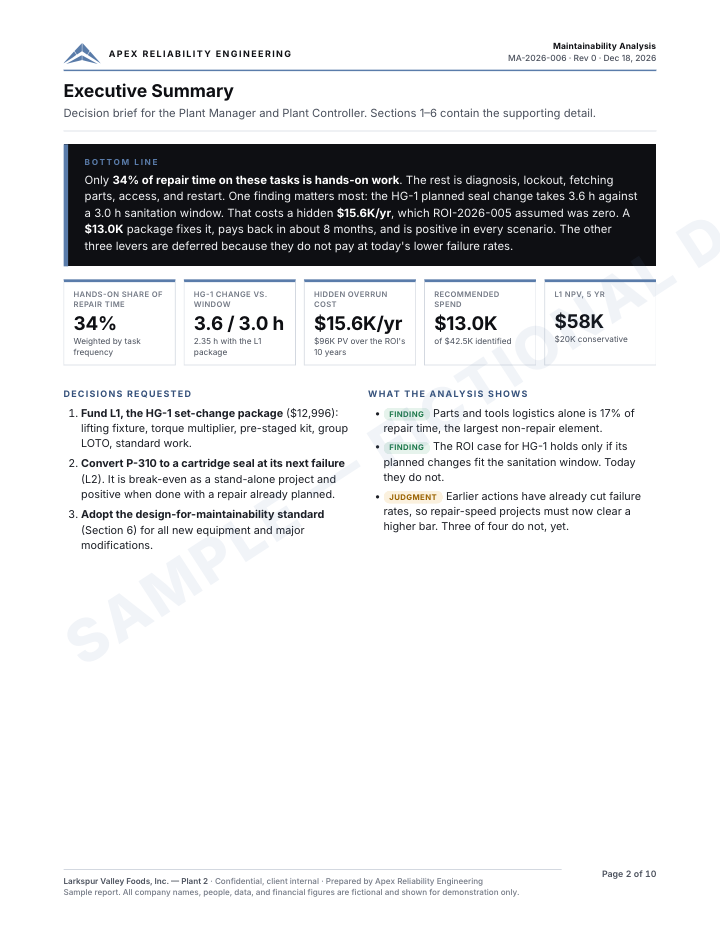
A fictional repair-time study separates hands-on work from diagnosis, lockout, parts retrieval, access and restart. It tests whether improvement ideas still pay when failure rates and operating windows are considered.
The sample identifies a planned seal change that exceeds the sanitation window assumed in the related ROI case. It funds one improvement package and defers three other levers at the sample's lower failure rates.
No email or account needed to download. An inquiry is optional and does not book work.
Inside the report
- Repair-time breakdown by element
- Operating-window and logistics constraints
- Improvement levers ranked by return
- A design-for-maintainability standard
The decision it supports
See why reducing wrench time alone may miss the main constraint, and how a maintenance-window assumption can change the investment decision.
“Only 34% of repair time on these tasks is hands-on work.”
The HTML summary highlights the purpose and limits. The complete PDF contains the analysis, assumptions, evidence and references.
Use the selection guide or download the complete portfolio →